10. Monitoring System
Table of contents
10.1. Overview
The Monitoring system is used to monitor various components of DIRAC. Currently, we have two monitoring types:
- WMSHistory: for monitoring the DIRAC WMS
- Component Monitoring: for monitoring DIRAC components such as services, agents, etc.
It is based on Elasticsearch distributed search and analytics NoSQL database. If you want to use it, you have to install the Monitoring service and elasticsearch db. You can use a single node, if you do not have to store lot of data, otherwise you need a cluster (more than one node).
10.2. Install Elasticsearch
You can found in https://www.elastic.co official web site. I propose to use standard tools to install for example: yum, rpm, etc. otherwise you encounter some problems. If you are not familiar with managing linux packages, you have to ask your college or read some relevant documents.
10.3. Configure the MonitoringSystem
You can run your El cluster without authentication or using User name and password. You have to add the following parameters:
- User
- Password
- Host
- Port
The User name and Password must be added to the local cfg file while the other can be added to the CS using the Configuration web application. You have to handle the EL secret information in a similar way to what is done for the other supported SQL databases, e.g. MySQL
For example:
Systems
{
  NoSQLDatabases
  {
    User = test
    Password = password
  }

}
10.4. Enable WMSHistory monitoring
You have to install the WorkloadManagemet/StatesMonitoringAgent. This agent is used to collect information using the JobDB and send it to the Elasticsearch database. If you install this agent, you can stop the StatesAccounting agent.
Note: You can use RabbitMQ for failover. This is optional as the agent already has a failover mechanism. You can configure RabbitMQ in the local dirac.cfg file where the agent is running:
Resources
{
  MQServices
  {
    hostname (for example lbvobox10.cern.ch)
    {
      MQType = Stomp
      Port = 61613
      User = monitoring
      Password = seecret
      Queues
      {
        WMSHistory
        {
          Acknowledgement = True
        }
      }
    }
  }
}
10.5. Enable Component monitoring
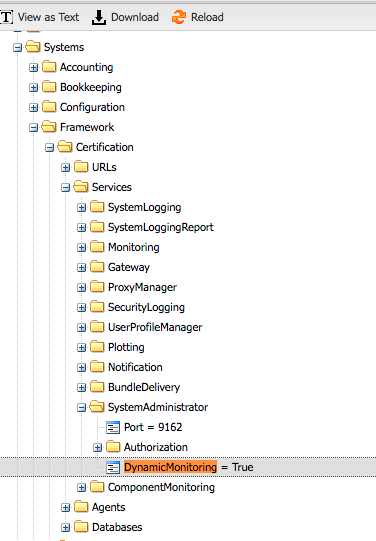
You have to set DynamicMonitoring=True in the CS:
Systems
{
   Framework
   {
       SystemAdministrator
        {
           ...
           DynamicMonitoring = True
         }
      }
    }
10.6. Accessing the Monitoring information
After you installed and configured the Monitoring system, you can use the Monitoring web application.